This
week we ended our ISB's Machine Learning course with the last two
lectures which were on Text Analysis and Mining graphs. The topics
covered were as follows:
Word2vec
Word2vec
is a two-layer neural net that processes text. Its input is a text
corpus and its output is a set of vectors: feature vectors for words in
that corpus. While Word2vec is not a deep neural network, it turns text into a numerical form that deep nets can understand.
The
purpose and usefulness of Word2vec are to group the vectors of similar
words together in vector space. That is, it detects similarities
mathematically. Word2vec creates vectors that are distributed numerical
representations of word features, features such as the context of
individual words. It does so without human intervention.
There
are two types of Word2Vec, Skip-gram and Continuous Bag of Words
(CBOW). I will briefly describe how these two methods work in the
following paragraphs.
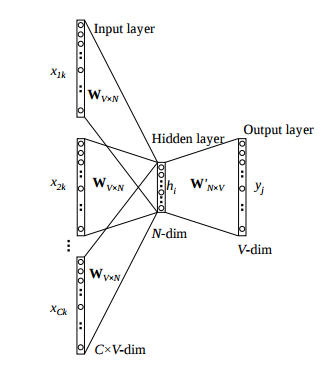
Skip-gram
Words are read into the vector one at a time and scanned back and forth within a certain range. Those ranges are n-grams, and an n-gram is a contiguous sequence of n items
from a given linguistic sequence; it is the nth version of unigram,
bigram, trigram, four-gram or five-gram. A skip-gram simply drops items
from the n-gram.
The graph below visualizes the network structure.
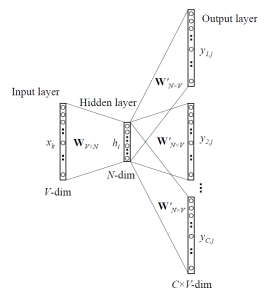
CBOW
Continuous
Bag of Words (CBOW) is very similar to skip-gram, except that it swaps
the input and output. The idea is that given a context, we want to know
which word is most likely to appear in it.
The biggest difference between Skip-gram and CBOW is that the way the word vectors are generated.
For CBOW, all the examples with the target word as a target are fed
into the networks and taking the average of the extracted hidden layer.
For example, assume we only have two sentences, “He is a nice guy” and
“She is a wise queen”. To compute the word representation for the word
“a”, we need to feed in these two examples, “He is a nice guy”, and “She
is wise queen” into the Neural Network and take the average of the
value in the hidden layer. Skip-gram only feeds in the one and only one
target word one-hot vector as input.
It
is claimed that Skip-gram tends to do better in rare words.
Nevertheless, the performance of Skip-gram and CBOW are generally
similar.
Mining Graphs
The Web as a Directed Graph
Viewing
social and economic networks in terms of their graph structures provides
significant insights, and the same is true for information networks
such as the Web. When we view the Web as a graph, it allows us to better
understand the logical relationships expressed by its links; to break
its structure into smaller, cohesive units; and to identify important
pages as a step in organizing the results of Web searches.
Early Search Engines and Term Spam
Techniques
for fooling search engines into believing your page is about something
it is not are called term spam. The ability of term spammers to operate
so easily rendered early search engines almost useless. To combat term
spam, Google introduced two innovations:
1.
PageRank was used to simulate where Web surfers, starting at a random
page, would tend to congregate if they followed randomly chosen outlinks
from the page at which they were currently located, and this process
was allowed to iterate many times. Pages that would have a large number
of surfers were considered more “important” than pages that would rarely
be visited. Google prefers important pages to unimportant pages when
deciding which pages to show first in response to a search query.
2.
The content of a page was judged not only by the terms appearing on
that page but by the terms used in or near the links to that page. Note
that while it is easy for a spammer to add false terms to a page they
control, they cannot as easily get false terms added to the pages that
link to their own page, if they do not control those pages.
Spectral Clustering
In multivariate statistics and the clustering of data, spectral clustering techniques
make use of the spectrum (eigenvalues) of the similarity matrix of the
data to perform dimensionality reduction before clustering in fewer
dimensions. The similarity matrix is provided as an input and consists
of a quantitative assessment of the relative similarity of each pair of
points in the dataset.
In application to image segmentation, spectral clustering is known as segmentation-based object categorization.
Satnam Sir's session on Cyber Security
Sir discussed the following topics in the session:
Data Exfiltration Detection
Exfiltration is a rather new word in the English language. In fact, it wasn’t used prevalently until recently.
By
definition, data exfiltration is the unauthorized copying, transfer, or
retrieval of data from a computer or server. It is a malicious activity
performed through various different techniques, typically by
cybercriminals over the internet or other networks.
More
specifically, data exfiltration is a security breach that occurs when
one’s data is illegally copied. Normally, it’s the result of a targeted
attack where the malicious actor’s primary intent is to find and copy
specific data from a specific machine. The hacker gains access to the
target machine through a remote application or by directly installing a
portable media device. These breaches often occur on systems that still
use the hardware/software vendor’s default password or an easy-to-guess
password.
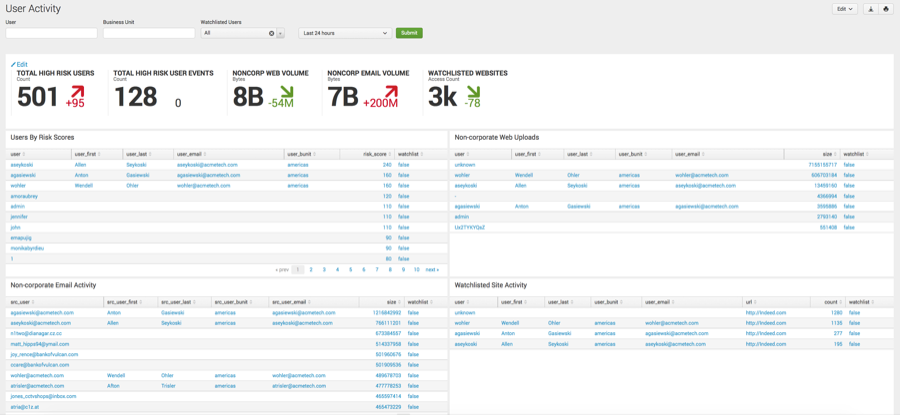
Splunk for Detecting and Stopping Data Exfiltration
Then he showed us how he used Splunk to detect unusual activity in the Weblogs.
The User Activity dashboard would display panels representing user activities such as potential data exfiltration. A spike in the volume or a high volume of key indicators such as Non-corporate Web Uploads and Non-corporate Email Activity can
indicate suspicious data transfer. The dashboard indicates a high
volume of suspicious activity involving data being uploaded to
non-corporate domains, as well as suspiciously large email messages sent
to addresses outside the organization.
The User Activity dashboard was used as the starting point to detect suspicious data exfiltration behavior. The Email Activity dashboard
exposed large data transfers to known and unknown domains. Using the
dashboards and searches provided with Splunk Enterprise Security, the
security analyst can check for common data exfiltration behaviors and
set up monitoring of potentially compromised machines and take necessary
remedial action.
Anamoly Detection algorithms
Anomaly detection is a technique used to identify unusual patterns that do not conform to expected behavior, called outliers.
Density-Based Anomaly Detection
Density-based anomaly detection is based on the k-nearest neighbor's algorithm.
Assumption: Normal data points occur around a dense neighborhood and abnormalities are far away.
The
nearest set of data points are evaluated using a score, which could be
Euclidean distance or a similar measure dependent on the type of the
data (categorical or numerical). They could be broadly classified into
two algorithms:
K-nearest neighbor:
k-NN is a simple, non-parametric lazy learning technique used to
classify data based on similarities in distance metrics such as
Euclidean, Manhattan, Minkowski, or Hamming distance.
Relative density of data: This is better known as local outlier factor (LOF). This concept is based on a distance metric called reachability distance.
Clustering-Based Anomaly Detection
Clustering is one of the most popular concepts in the domain of unsupervised learning.
Assumption: Data
points that are similar tend to belong to similar groups or clusters,
as determined by their distance from local centroids.
K-means is
a widely used clustering algorithm. It creates 'k' similar clusters of
data points. Data instances that fall outside of these groups could
potentially be marked as anomalies.
Support Vector Machine-Based Anomaly Detection
A support
vector machine is another effective technique for detecting anomalies.
An SVM is typically associated with supervised learning, but there are
extensions (OneClassCVM, for instance) that can be used to identify
anomalies as an unsupervised problem (in which training data are not
labeled). The algorithm learns a soft boundary in order to cluster the
normal data instances using the training set, and then, using the
testing instance, it tunes itself to identify the abnormalities that
fall outside the learned region.
Depending
on the use case, the output of an anomaly detector could be numeric
scalar values for filtering on domain-specific thresholds or textual
labels (such as binary/multi labels).
He
then asked us to work on a Kaggle dataset of Credit Card Fraud
Detection problem. He asked us to solve it as an anomaly detection
problem rather than a classification problem.
Simple linear regression is useful for finding a relationship between two continuous variables. One is a predictor or independent variable and other is a response or dependent variable. It looks for a statistical relationship but not a deterministic relationship. The relationship between the two variables is said to be deterministic if one variable can be accurately expressed by the other. For example, using temperature in degree Celsius it is possible to accurately predict Fahrenheit. Statistical relationship is not accurate in determining the relationship between two variables. For example, the relationship between height and weight. With simple linear regression we want to model our data as follows: y = B0 + B1 * x This is a line where y is the output variable we want to predict, x is the input variable we know and B0 and B1 are coefficients we need to estimate. It also required us to understand the concept of gradient descent. Gradient Descent is the process of m...
Tuples We saw that lists and strings have many common properties, such as indexing and slicing operations. They are two examples of sequence data types (see Sequence Types — str, bytes, bytearray, list, tuple, range). Since Python is an evolving language, other sequence data types may be added. There is also another standard sequence data type: the tuple. A tuple consists of a number of values separated by commas, for instance: >>> t = 12345, 54321, 'hello!' >>> t[0] 12345 >>> t (12345, 54321, 'hello!') >>> # Tuples may be nested: ... u = t, (1, 2, 3, 4, 5) >>> u ((12345, 54321, 'hello!'), (1, 2, 3, 4, 5)) As you see, on output tuples are always enclosed in parentheses, so that nested tuples are interpreted correctly; they may be input with or without surrounding parentheses, although often parentheses are necessary anyway (if the tuple is part of a larger expression). Tuples have many uses. For example: (x, y) c...
Ropar's Accident data Our company was given Ropar's Accident data by the Government to analyze and submit insights from the data that could be helpful to the government for reducing the number of serious accidents. We analyzed the data by using Tableau with the help of pie charts, histograms, etc. We also made dashboards and stories which gave us a really good insight of the data. Convolutional Neural Networks We referred to the CMU's course on deep learning for understanding this concept.This lecture was taught by Bhiksha Raj Sir. CNNs, like neural networks, are made up of neurons with learnable weights and biases. Each neuron receives several inputs, takes a weighted sum over them, pass it through an activation function and responds with an output. Unlike neural networks, where the input is a vector, here the input is a multi-channeled image. The wholw network has a loss function. CNNs have wide applications in image and video rec...

Comments
Post a Comment